The installed capacity of Kazakhstan’s power plants in 2020 amounted to 23,547 MW, which is 611 MW more in comparison with the last year.
The available capacity of the RK power plants made 20,039.1 MW, which is 710 MW more than last year, incl. an increase in the Northern zone – 336.6 MW, the Western zone – 77.7 MW, the Southern zone – 296.4 MW.
Electricity was mainly produced at thermal power plants – 80.2 %, the share of hydropower plants accounted for 8.8 %, and the share of renewable energy sources was about 3 %.
The northern zone produced 76.8 % of electricity of the country’s overall production. Main coal deposits and water and energy resources are located in the northern zone. Excess electricity is transferred to the southern zone experiencing power shortages and is exported to the Russian Federation.
The southern zone is characterized by a shortage of electricity covered owing to supplies from the northern zone, where the share of electricity generation was 10.7 %.
The western zone – A significant share of electricity consumption is made by oil and gas companies with their own generating sources. There are no electrical connections of the West with the North and South of Kazakhstan through the territory of the country.
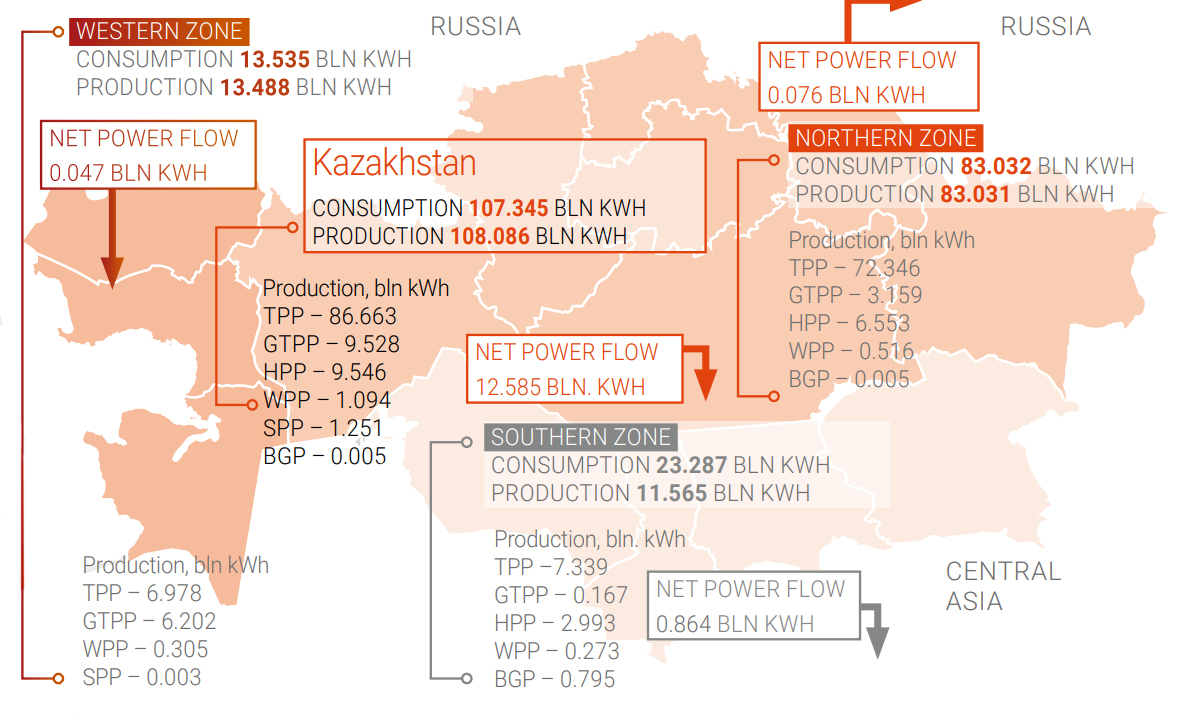
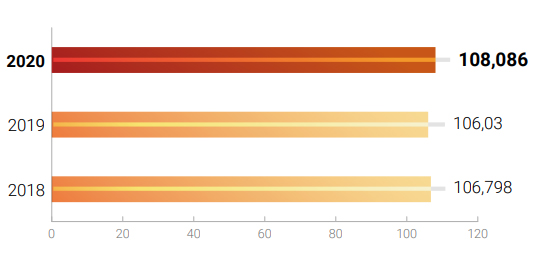
According to the data from System Operator, Kazakhstan’s power plants produced 108,086 mln kWh of electricity in 2020, which is 1.9 % more than in the same period of 2019.
Electricity production was available in all zones of Kazakhstan UES. Electricity generation at Kazakhstan HPP and GTPP increased in comparison with the same period in 2019 by 707.6 mln kWh (0.8 %) and 552.1 mln kWh (6.2 %) respectively.
Electricity generation at HPP of Kazakhstan decreased by 439.1 mln kWh (4.4 %). The operation mode of power plants was established according to water balance and hydrologic situation.
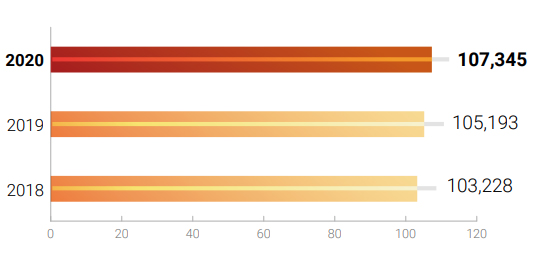
According to the System Operator, electricity consumption increased by 2 % over time in 2020 in the republic in comparison with the 2019 indicators. Thus, in the northern zone of the republic, consumption increased by 2 %, in the southern zone by 3 %, and in the western zone by 1 %.
In 2020, in comparison with the same period in 2019, Pavlodar region shows the maximum increase in electricity consumption by 1,204.4 mln kWh (6 %), Zhambyl region – by 475.6 mln kWh (11 %), Karaganda region – by 470.3 mln kWh (3 %), West Kazakhstan region – by 258.7 mln kWh (13 %).
In the dynamics of electricity consumption, there was a 2 % increase in comparison with the 2019 figures. So, in the northern zone of Kazakhstan, consumption increased by 2 %, in the western zone by 1 % and in the southern zone by 3 %.
Electricity indicators across the Republic of Kazakhstan, mln kWh
|
No. |
Indicators across the RK |
2018 |
2019 |
Δ 2019/ 2018 |
2020 |
Δ 2020/ 2019 |
|
1. |
Electricity consumption |
103,228.3 |
105,193.1 |
2 % |
107,344.8 |
2 % |
|
2. |
Electricity production, incl.: |
106,797.1 |
106,029.8 |
0.9 % |
108,085.8 |
1.9 % |
|
|
TPP |
86,795.1 |
85,955 |
0.9 % |
86,662.6 |
0.8 % |
|
|
GTPP |
9,119.3 |
8,975.6 |
0.9 % |
9,527.7 |
6.2 % |
|
|
HPP |
10,343.0 |
9,984.9 |
0.9 % |
9,545.8 |
–4.4 % |
|
|
WPP |
400,.5 |
701.9 |
75 % |
1,094.1 |
55.9 % |
|
|
SPP |
137.9 |
409.4 |
197 % |
1,250.7 |
205.5 % |
|
|
Biogas plant |
1.3 |
3 |
131 % |
4.9 |
63.3 % |
|
3. |
Net power flow “+” shortage, “-“ excess incl.: |
–3,568.8 |
–836.7 |
23.4 % |
–741 |
88.5 % |
|
|
Russia |
–3,566 |
–3,057.8 |
–85.7 % |
123.1 |
–0.0004 % |
|
|
Central Asia |
–2.8 |
–962.4 |
–34,371 % |
–864.1 |
0.009 % |
POWER PRODUCTION BALANCE IN THE RK, bn kWh
POWER CONSUMPTION BALANCE IN THE RK, bn kWh
EXPORT AND IMPORT OF THE REPUBLIC OF KAZAKHSTAN ELECTRICITY
Russia has been the main export and import direction for the Republic of Kazakhstan electricity in January– December 2020 (exports to the RF – 1,105.9 mln kWh, imports from the RF – 1,240.6 mln kWh).
To “KEGOC” JSC – 1,065.6 bn kWh in order to balance electricity production and consumption. During the reporting period 982.3 mln kWh electricity was imported from the RF in order to balance power production and consumption.
Export and import of the Republic of Kazakhstan electricity, mln kWh
|
Description |
2018 |
2019 |
2020 |
Δ 2019/2018 |
|
|---|---|---|---|---|---|
|
mln kWh |
% |
||||
|
Kazakhstan’s export |
4,882.4 |
2,189.5 |
–1,968.7 |
2,405.6 |
–55.0 |
|
to Russia |
4,876.3 |
1,273.6 |
–1,105.9 |
3,262.2 |
–74.7 |
|
ESDPP-1 |
3,758.0 |
0.0 |
0.0 |
3,247.1 |
–100.0 |
|
“SevKazEnergo” JSC |
68.7 |
58.0 |
–40.3 |
28.9 |
–41.8 |
|
“KEL” LLP |
0.0 |
0.05 |
–1,065.6 |
–13.8 |
1.3 |
|
“KEGOC” JSC (balancing market) |
1,049.6 |
1,215.6 |
–862.8 |
–856.6 |
14,016.3 |
|
to UES of Central Asia |
6.1 |
962.4 |
–806.6 |
–806.6 |
|
|
ESDPP-1 |
0.0 |
966.6 |
–3.7 |
2.5 |
–40.1 |
|
“KEGOC” JSC for “NPS of Kyrgyzstan”OJSC |
6.1 |
3.7 |
–52.5 |
–52.5 |
|
|
Kazakhstan’s import |
1,313.6 |
1,415.0 |
1,555.4 |
238.9 |
18.1 |
|
from Russia |
1,310.2 |
1,407.1 |
1,240.6 |
–72.6 |
–5.5 |
|
“INTER RAO” PJSC |
291.7 |
268.4 |
258.3 |
–31.5 |
–10.9 |
|
“INTER RAO” PJSC (purchase agreement) (balancing market) |
1,018.6 |
1,138.6 |
982.3 |
–41.1 |
–4.0 |
|
From UES of Central Asia |
3.3 |
7.9 |
314.8 |
311.5 |
9,331.5 |
|
“NPS of Kyrgyzstan” OJSC for “KEGOC” JSC» |
3.3 |
7.9 |
302.6 |
299.3 |
8,966.1 |
|
power flow “+” shortage, “-“ excess |
–3,568.8 |
–836.7 |
–741 |
95.7 |
88.5 |