|
№ |
Indicator, mln tenge |
2018 (actual) |
2019 (actual) |
2020 (actual) |
2021 (forecast) |
2022 (forecast) |
|---|---|---|---|---|---|---|
|
1 |
Income from sales of goods and services delivered |
260,400 |
243,722 |
283,010 |
321,775 |
389,336 |
|
1.1. |
Electricity production |
185,355 |
169,369 |
207,917 |
235,138 |
294,007 |
|
1.2. |
Sale of electricity by energy supplying organizations |
96,955 |
100,171 |
106,911 |
122,925 |
136,896 |
|
1.3. |
Heat production |
21,674 |
16,781 |
19,202 |
18,124 |
20,518 |
|
1.4. |
Transmission and distribution of electricity |
40,020 |
38,028 |
40,685 |
45,339 |
49,035 |
|
1.5. |
Sale of chemically purified water |
1,824 |
1,515 |
1,626 |
1,744 |
1,797 |
|
1.6. |
Lease |
3,542 |
3,925 |
4,041 |
3,778 |
3,779 |
|
1.7. |
other |
1,597 |
2,555 |
3,181 |
4,005 |
5,678 |
|
2 |
Cost of goods sold |
(188,356) |
(195,891) |
(225,185) |
(258,257) |
(277,718) |
|
2.1. |
Cost of electricity production |
(129,110) |
(130,934) |
(156,182) |
(179,822) |
(197,127) |
|
2.2. |
Cost of electricity sales by energy supplying organizations |
(95,938) |
(101,280) |
(111,195) |
(124,062) |
(135,831) |
|
2.3. |
Cost of heat production |
(20,023) |
(16,338) |
(18,804) |
(19,558) |
(20,337) |
|
2.4. |
Cost of electricity transmission |
(30,068) |
(32,543) |
(54,365) |
(39,756) |
(42,579) |
|
2.5. |
Cost of sale of chemically purified water |
(1,736) |
(1,356) |
(1,679) |
(1,917) |
(1,913) |
|
2.6. |
Cost of other types of core business |
(640) |
(832) |
(946) |
(1,124) |
(1,065) |
|
|
Amortization of fixed and intangible assets |
(52,364) |
(54,223) |
(57,331) |
(60,354) |
(65,898) |
|
3 |
Gross profit |
72,044 |
47,832 |
57,826 |
63,518 |
111,618 |
|
4 |
Financing income |
2,333 |
2,377 |
2,916 |
534 |
421 |
|
5 |
Other income (1) (4) |
5,347 |
5,376 |
4,637 |
282 |
261 |
|
6 |
Expenses for sale of products and services |
(14,340) |
(7,999) |
(10,202) |
(12,467) |
(10,458) |
|
7 |
General and administrative expenses |
(13,018) |
(12,710) |
(15,826) |
(13,532) |
(13,498) |
|
8 |
Operating profit |
44,686 |
27,123 |
31,798 |
37,518 |
87,662 |
|
9 |
Earnings before amortization, interest and CIT (EBITDA) |
97,825 |
82,487 |
99,728 |
108,446 |
170,443 |
|
10 |
Finance costs (2) (3) (4) |
(33,129) |
(32,319) |
(31,025) |
(32,327) |
(32,370) |
|
11 |
Other expenses from non-core operations (4) |
(16,549) |
(1,920) |
(4,061) |
(95) |
(98) |
|
12 |
Share of profit / loss of organizations accounted for using the equity method and investments impairment |
9,752 |
11,191 |
9,474 |
9,660 |
15,956 |
|
13 |
Profit (loss) from discontinued operations |
–1,584 |
0 |
0 |
0 |
0 |
|
|
Profit (loss) from disposal of subsidiaries |
287 |
0 |
0 |
0 |
0 |
|
14 |
Profit (loss) before tax |
11,143 |
11,829 |
13,739 |
15,572 |
71,834 |
|
15 |
Corporate income tax expenses |
(7,718) |
(4,717) |
(5,655) |
(4,671) |
(14,707) |
|
16 |
Total profit before minority interest |
3,425 |
7,111 |
8,083 |
10,901 |
57,127 |
|
17 |
Minority interest |
184 |
276 |
76 |
297 |
297 |
|
18 |
Total profit attributable to the Group’s Shareholders |
3,241 |
6,835 |
8,008 |
10,604 |
56,829 |
(1) in FS forex gains for 2018 were reported in “other income” section
(2) in FS forex loss for 2018 was reported in “finance costs” section
(3) in FS forex gain for 2019 was reported in “financial income” section
(4) in FS forex gain for 2020 was reported in “other income” section
(5) in FS forex loss for 2020 was reported in “financial costs” section
(6) in FS impairment loss (NET) was recognized in “other expenses” item
Note: interpretation of income and cogs was presented with a breakdown by types of activities (not by segments) and was mentioned without elimination.
Revenues from sales of products and services provided across “Samruk-Energy” JSC group of Companies in 2020 amounted to 283,010 mln tenge:
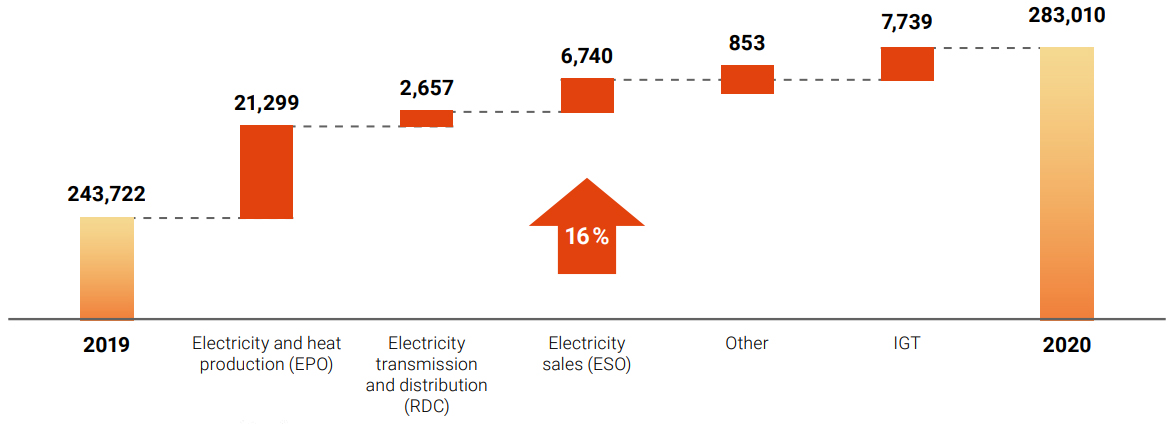
Consolidated revenue increased in the electricity production segment due to the growth of tariffs and volumes of electricity sales. The main increase was made by “Almaty Power Plants’ JCS due to the growth of tariff for electricity, also by “Ekibastuz SDPP-1” LLP due to the increase in electricity sales volumes by 1,466 mln kWh.
The increase in revenue for electricity transmission is associated with a growth in the tariff for electricity transmission of “Alatau Zharyk Kompany” JSC from 5.46 tenge/kWh to 5.95 tenge/kWh.
In the sales segment, revenue growth is associated with a growth in the electricity sales of “AlmatyEnergoSbyt” LLP from 16.11 tenge/kWh to 17.66 tenge/kWh.
Forecast for future period:
in the forecast for 2021, revenue from sales is planned at 321,775 mln tenge, which is 38,765 mln tenge or 14 % higher than 2020 actual figure. The increase was caused by growth of tariff for electricity transmission and production of electricity and also by growth of electricity sales volumes.
Revenue increases in the forecast for 2021 compared to the forecast for 2020, this is because of growth of revenues from electricity production mainly owing to “Ekibastuz SDPP-1” LLP. Also, the growth in revenues from electricity transmission and sales are expected because of an increase in volumes and tariffs.
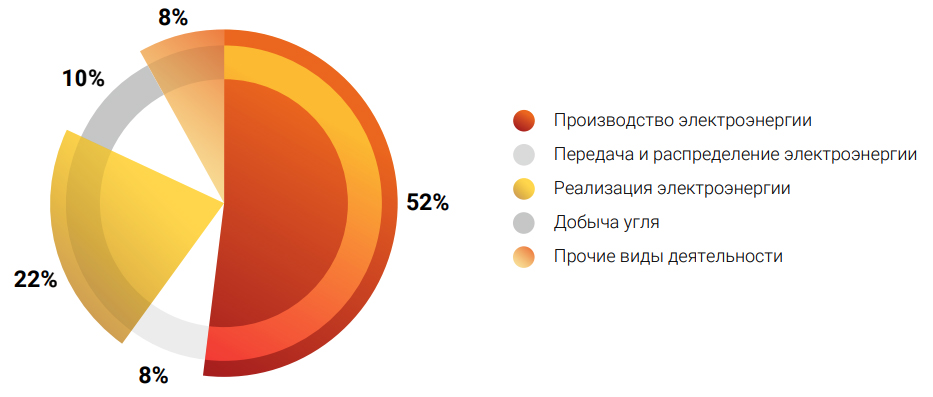
Structure of 2020 income by main types of activity
Revenues from sales of products and services rendered detailed per producer
|
Indicator, mln tenge |
2018 (actual) |
2019 (actual) |
2020 (actual) |
2021 (forecast) |
2022 (forecast) |
|---|---|---|---|---|---|
|
Income from sales of products and services rendered |
260,400 |
243,722 |
283,010 |
321,775 |
389,336 |
|
“ESDPP-1” LLP |
125,598 |
108,017 |
123,478 |
142,526 |
192,854 |
|
“AlmatyEnergoSbyt” LLP |
96,955 |
100,171 |
106,911 |
122,925 |
136,896 |
|
“Almaty Power Plants” JSC |
65,542 |
64,047 |
74,481 |
79,768 |
86,198 |
|
“Alatau Zharyk Company” JSC |
40,258 |
38,167 |
40,819 |
45,440 |
49,139 |
|
“Moynak HPP” JSC |
10,217 |
9,883 |
20,520 |
20,863 |
20,819 |
|
“FWPP” LLP |
4,460 |
4,592 |
5,031 |
5,514 |
5,734 |
|
“Shardarinsk HPP” JSC |
3,318 |
2,279 |
6,761 |
8,405 |
9,657 |
|
“Bukhtarminsk HPP” JSC |
3,541 |
3,924 |
4,040 |
3,778 |
3,779 |
|
“Ereymentau Wind Power” LLP |
|
|
|
|
4,827 |
|
“Energy Solution center” LLP |
937 |
1,105 |
1,287 |
1,457 |
1,407 |
|
«Samruk Green Energy» LLP |
141 |
158 |
236 |
377 |
399 |
|
Intercompany turnover (elimination) |
–90,566 |
–88,621 |
–100,554 |
–109,278 |
–122,372 |
The major share in the Company’s operating income comes from “Ekibastuz SDPP-1” LLP, “Almaty Power Plants” JSC, “Alatau Zharyk Company” JSC, “AlmatyEnerogSbyt” LLP. At the same time, at consolidation of revenues, intercompany turnover mainly in respect of energy producing and distribution companies is excluded from total amount.
Cost of goods and services
|
Indicator, mln tenge |
2018 (actual) |
2019 (actual) |
2020 (actual) |
2021 (forecast) |
2022 (forecast) |
|---|---|---|---|---|---|
|
Fuel |
56,768 |
52,340 |
59,109 |
61,957 |
69,252 |
|
Remuneration of labor and related expenses |
25,231 |
26,775 |
29,394 |
31,040 |
32,326 |
|
Cost of purchased electricity |
10,178 |
13,673 |
22,865 |
39,442 |
40,458 |
|
Maintaining the availability of electric capacity |
|
7,692 |
10,094 |
9,725 |
10,003 |
|
Depreciation of property, plant and equipment and amortization of intangible assets |
52,364 |
54,227 |
57,331 |
60,354 |
65,898 |
|
Maintenance & repair |
6,344 |
6,879 |
8,520 |
10,860 |
11,469 |
|
Services for electricity transmission and other services |
10,019 |
10,331 |
11,494 |
11,664 |
12,099 |
|
Materials |
1,773 |
1,844 |
1,713 |
2,071 |
2,311 |
|
Water supply |
4,664 |
3,962 |
4,847 |
5,799 |
6,436 |
|
Grid losses |
193 |
193 |
2 |
4 |
4 |
|
Taxes other than income tax |
4,876 |
4,586 |
4,589 |
5,717 |
6,431 |
|
Emission charges |
4,036 |
4,338 |
4,731 |
5,208 |
5,413 |
|
Outsourced services |
8,219 |
5,383 |
6,003 |
10,984 |
12,066 |
|
Other |
3,690 |
3,668 |
4,492 |
3,433 |
3,552 |
|
TOTAL |
188,356 |
195,891 |
225,185 |
258,257 |
277,718 |
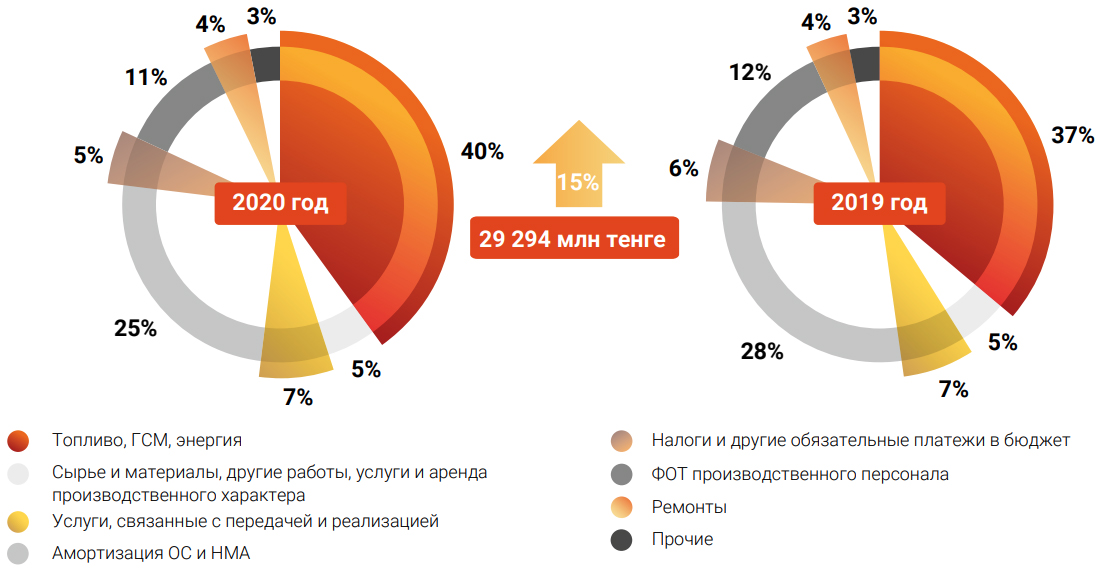
According to results of 2020, Cost of goods sold amounted to 225,185 mln tenge, which is 15 % higher than 2019 actual figure. The increase in costs is mainly due to the increase in coal costs (increase in the price of coal and production volumes) and the cost of purchased electricity from SFC RES LLP (increase in tariffs and purchase volumes). There is also an increase in expenses due to the growth in prices for goods and services, and an increase in depreciation (mainly at “Ekibastuz SDPP-1” LLP)
The structure of cost of goods sold by main types of activity
Forecast for the future period: in the forecast for 2021, cost increases due to an increase in production and sales, as well as due to an increase in prices for goods and services. The increase in expenses in the forecast for 2022 is due to higher prices for goods and services.
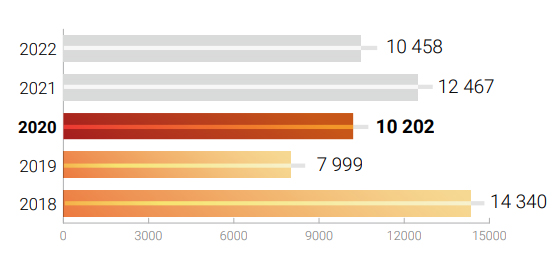
Forecast for the future period: In the forecast for 2021, the increase in sales costs in comparison with the fact of 2020 is 22 % due to an increase in electricity exports from 859 mln kWh to 1,500 mln kWh.
Sales costs, mln tenge
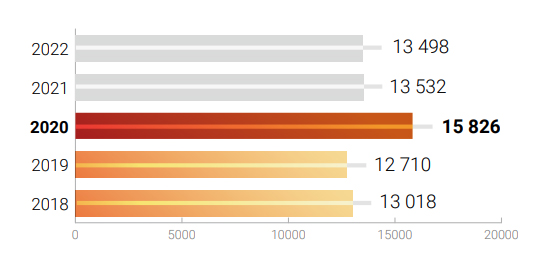
Administrative expenses, mln tenge
Sales costs in 2020 increased by 2,203 mln tenge compared with 2019 and amounted to 10,202 mln tenge. This deviation is caused by the increase in prices for the services of KEGOC JCS.
At the end of 2020, administrative expenses amounted to 15,826 mln tenge, which is 3,116 mln tenge or 25 % higher in comparison with the same period in 2019. The increase is mainly due to additional taxes on VAT and the accrual of penalties for “BHPP” JCS as a result of a comprehensive audit by the Department of State Revenues in East Kazakhstan for the period from 01.01.2014 until 31.12.2018.
At the same time, the decrease in the costs of the UAR, excluding the costs of the BHPP, amounted to 1 % (143 million tenge).
Forecast for the future period: Administrative expenses in the forecast for 2021 are lower than in 2020 and amount to 13,532 mln tenge. The decrease is mainly due to lower tax expenses.
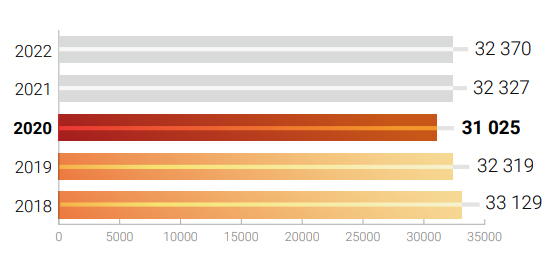
According to 2020 results, finance costs amounted to 31,025 mln tenge, which is 1,294 mln tenge lower than 2019 actual figure. Finance costs decreased mainly due to mainly due to reduction of interest expenses in connection with longterm loan repayments.
Forecast for the future period: in the forecast for 2020–2021, financing costs increase due to additional borrowings from subsidiaries and affiliates in order to replenish working capital
Finance costs, mln tenge
Share of profits of joint ventures and associates and impairment of investments, mln tenge
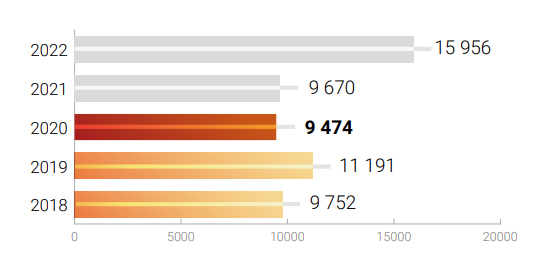
Share of profits of joint ventures and associates
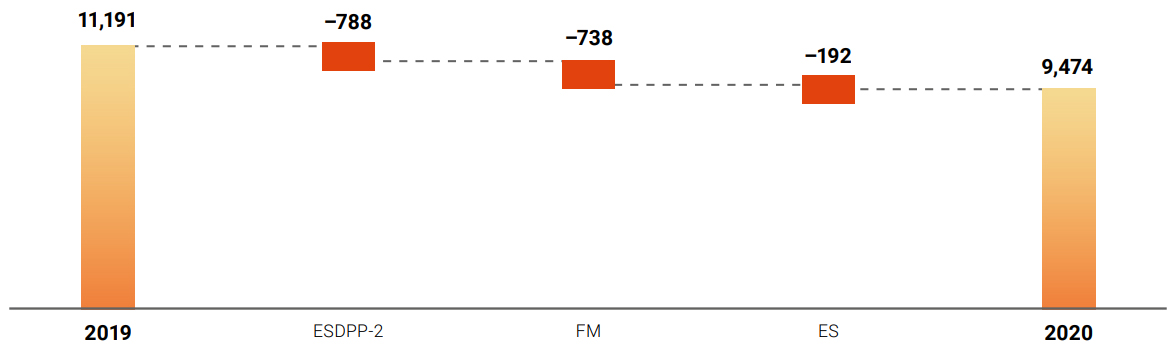
Share income for 2020 amounted to 9,474 mln tenge, the decrease of 1,718 mln tenge compared to the same period.
The main changes occurred with respect to the following assets:
“Ekibastuz SDPP-2 Plant” JSC – increase in loss by (788) mln tenge in comparison with the previous year was caused because of the below factors:
- increase in financing costs by (795) mln tenge.
- increase in expenses on exchange rate differences in the amount of (366) mln tenge.
Forum Muider – a decrease in profit by 738 mln tenge was mainly driven by the decrease of coal sales volumes at “Bogatyr-Komir” LLP by 1,249 thous. tons (3 %).
In the plan for 2020, the share of profit is 9,670 mln tenge, 15,956 mln tenge in 2022